
The Team Stats that Matter
Each year, more and more stats are thrown at fans with little indication of what is meaningful. Using last season's URC's data via Opta, let's see what's different between the best and the rest.

A former boss once told me, “it’s data so it must be useful, right?” This seemed so wrong-headed at the time that I didn’t have the words to explain that most data is useless for a given context, that the phrase “to find the signal in the noise” exists because discerning what data is actually useful, rather than assuming it all is, is a highly valued skill.
Looking back now, I sympathise more with his view. We are constantly bombarded with more data in the belief knowing more will solve all our problems. New metrics are sold as the next must-have in fandom where you’ll miss out if you can’t follow the pub chat on why it’s surprising the team is winning 5-0 considering the xG. On top of that, everything needs to be smart from your phone to your toaster. Everywhere you look, we are being told that more data is better.
Rugby is no different, as teams and players look for the next edge and tactical wrinkle worth exploiting1. I am no different: recently I met someone at the URC who offered to make some data available if I let them know what I wanted. I sent them a list with 111 different data points. However, what we need to remember is that the experts may have all the data, but they only look at what is relevant to answer each specific question.
So, if the question is which teams are most likely to be successful, which data separates the champs from the chumps?
Carries
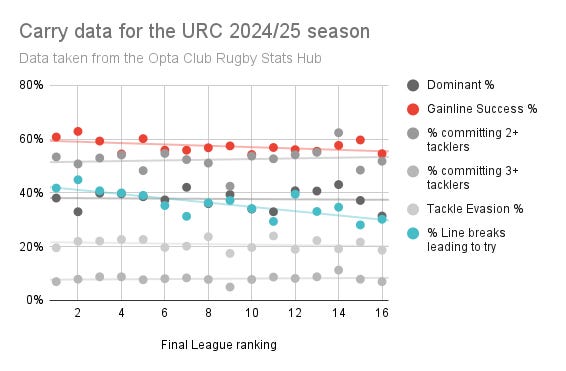
Data that matters
Gainline Success and the percentage of line breaks that lead to a try are the most significant indicators of a successful team. Gainline success makes sense in a collision sport (how many times have we heard “you need to win the collisions”?) but what really sets the better teams apart is the ability to turn a line break into a try. The Ospreys (12th) and Edinburgh (7th) are the biggest outliers, but generally if you finish off 40% of your breaks then you’ll be playing at the top end.
Data that doesn’t matter
The other 4 stats all sound like they should relate to team success if gainline success is important, but we need to remember that context matters. For example, dominant carries2 will help the team move forward, but is the percentage so high because you’ve large players who consistently dominate, or because your style of play relies heavily on big carries, making it easier for teams to defend? The first can be part of a successful tactical approach while the second can leave a team struggling without a plan B.
Offloads
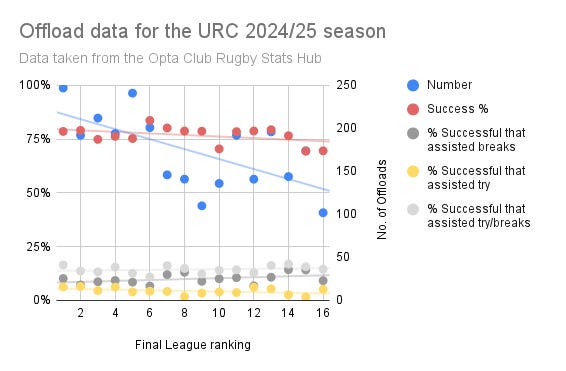
Data that matters
When we look at which how successful offloads are, there is really very little difference across the league. There is some positive correlation between Success % and the % of successful offloads that lead to a try, but it is small. The big differentiator is that the more successful teams and attempt a lot more offloads leading to more good outcomes. And, in case you think that better teams make more offloads because they make more carries, the Bulls and Stormers actually make fewer carries than average so there offload rate is way higher than many other teams.
Data that doesn’t matter
Interestingly, the % of successful offloads that assisted breaks trends negatively to league ranking. This may also be related to the volume of offloads; the better teams are just making lots of offloads in the belief that eventually they will lead to break/positive outcomes. On the other hand, the less successful teams are more likely to try an offload when they think it will lead to a break. Of course, the difference is small so it may not mean anything.
Tackles
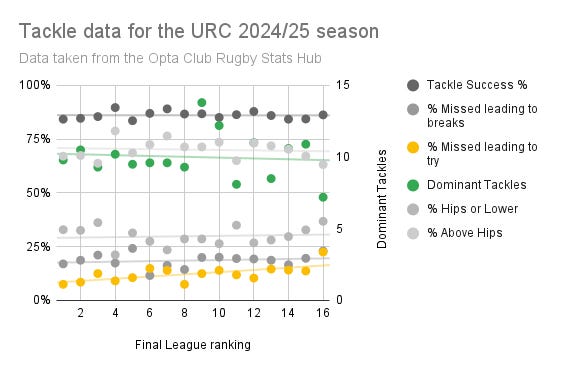
Data that matters
As with the carries we see successful teams see more Dominant Tackles3 but the difference is small. Indeed, Cardiff and Benetton appear to be the big hitters. The most significant data is the % of missed tackles that lead to a try. It looks like the better teams are better at recovering from mistakes - whether it is an issue of fitness, coaching or better structure (i.e. miss tackles in the right areas), the best teams will make you play another shot, to borrow an example from tennis.
Data that doesn’t matter
The tackle success percentage and how high the tackle is are basically the same across the board, which kind of makes sense. They are professional players who have practised tackling for years; it would be odd if one group was consistently and significantly better than another. The key really does appear about missing at the right time and recovering when things go wrong.
Lineouts
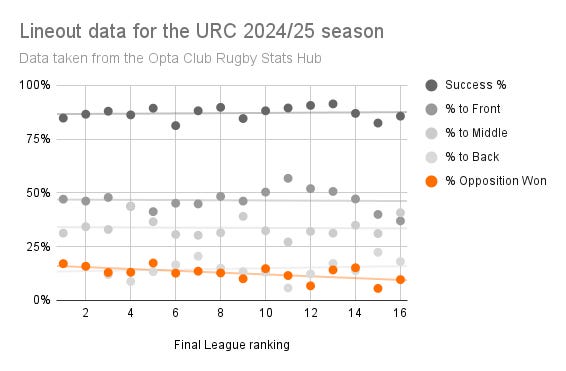
Data that matters
The best teams are more likely to win opposition ball with top teams winning between 1 in 6 and 1 in 8 throws. This may be a case of a winning team being more likely to gamble on challenging the throw (thereby being more vulnerable to an attack if they don’t win the lineout) or it could be something they are more skilled at. My belief is that the best teams have weapons for every scenario and are therefore best placed to win opposition ball.
Data that doesn’t matter
Considering how often pundits go on about lineout success, it may be a surprise to see there is no difference in Success % across the league. If anything, the top teams might be slightly less successful! The proportion of throws to the front, middle and back does not vary much across the league - each team knows they need some variation, and they are more likely to choose the safer option at the front than the more dangerous back option even if that opens up more opportunities.
Scrums
Data that matters
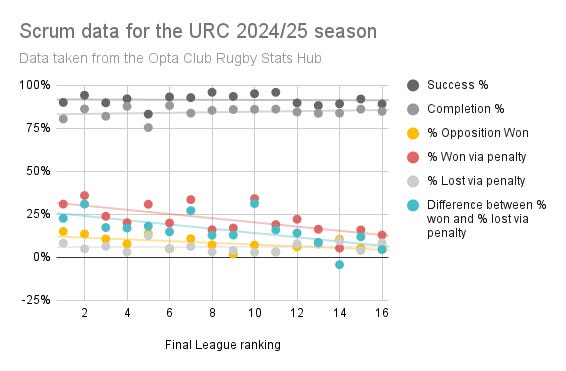
What sets out successful teams regarding the scrum, is how much they can attack the opposition (% Opposition won, % won via penalty). For many people, it would be better if the scrum was simply a way to restart the game for the more attractive parts of the game, but being able to out-muscle your opponents is clearly still an important part of being successful in union.
Take Ulster for example, placed 14th. Defensively, they performed about as well as the other teams, but they won very few penalties and therefore struggled to put any pressure on. If your team is just struggling to hang in there, you can never play on the front foot on at attack or defence. Considering how many scrums there are, any team will struggle to compete regardless of the level of talent in the squad.
Data that doesn’t matter
The Success % and Completion % data are not sufficiently contextual to give any clear insight. How a pack manages to successfully complete a scrum is much more important than whether they did or not. Stormers (placed 5th) had the lowest completion rate by a distance, but that might be due to a more attacking mindset. Either they are trying to attack the opposition scrum (hence the higher penalties won) and get it wrong sometimes leading to incomplete scrums, or their backrow wants to detach quickly to tackle or carry and are not fully engaged. The stats suggest this approach leads to better outcomes overall compared to the more conservative approach of defending what you have.
Mauls
Data that matters
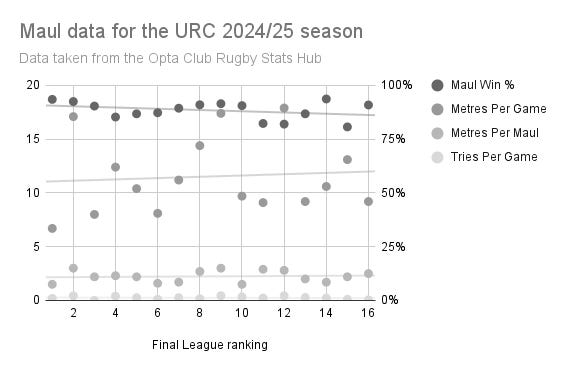
It’s hard to say any of this data indicates which teams will be more successful.
Data that doesn’t matter
The closest to being relevant is the Maul Win % as better teams tend to do a bit better. However, if a team only mauls once a game does it matter if they are successful most of the time. There is also a suggestion that better teams maul fewer metres per game, possibly indicating they have a more varied game. But then there are the Bulls who have been consistently successful for years by using their conveyor belt of massive humans to maul their victims backwards. For the same reason, the metres per maul and tries per game are not good indicators.
Team Movement
Data that matters
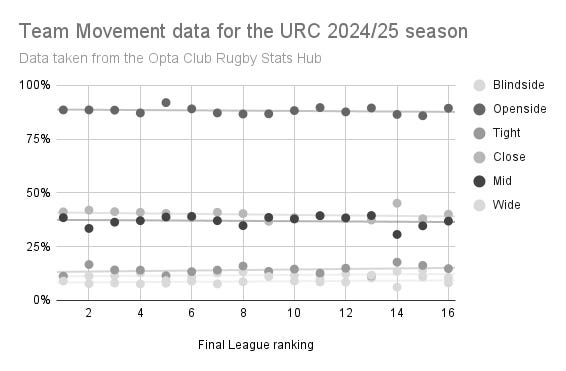
As with the maul stats, there is no correlation between success and these metrics. One thing I find interesting (and this might not be clear due to the colour scheme) is any variation between teams is how much they play tight/close and mid; all the teams play wide about the same amount.
Data that doesn’t matter
All of it. However, I will take the chance to flag Ulster’s relative reliance on moving tight or close. All the data, not just this, suggests Ulster went with a very simple playbook last season, which may explain the long stretches in games without scoring - the opposition simply worked out there was no plan B.
Tries
Data that matters
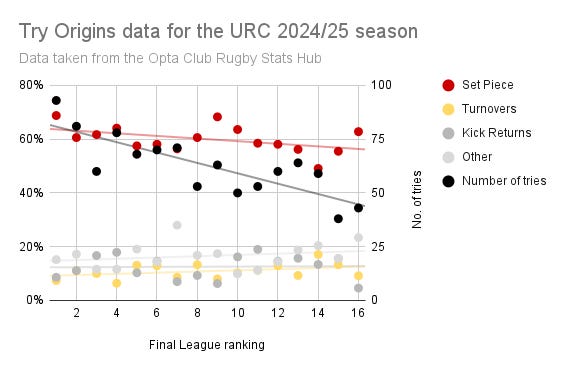
The most notable differences are the proportion of tries that come from set pieces or turnovers. The better teams score more tries from set piece, as expected. Better players, better coaches and better plans lead to better outcomes. I also highlighted the turnover % because though it looks like worse teams are better at scoring tries in this context, it is actually only showing their greater reliance on these tries. The graph appears to show a team like the Bulls scoring as many turnover tries as Zebre or the Dragons, but the Bulls scored as many as the other two teams combined. What this tells us is weaker teams live more off scraps because they struggle to generate their own structured offence.
Data that doesn’t matter
The kick return data is pretty even across league, with the Lions and especially Glasgow particularly dangerous. But as these two teams show, great kick return doesn’t mean you will be particularly successful or not - it’s just a particular skill.
Conclusions
For me there are a couple of big take-aways.
The best teams have an attacking mindset. Attack the scrum and win the penalty. Attack the opposition lineout. Keep trying offloads until one works. Missed a tackle? Attack the break and make it as difficult as possible to finish with a try. Some people might describe this as intensity, but I think it’s a step further. You can defend with intensity, but the best teams are always looking for opportunities to turn defense into attack.
Whatever they choose to do the best teams do them very well. The Bulls and Leinster play the game differently but both teams are highly skilled in what they do. Any team can decide they are going to dominate off set pieces or attack opposition lineouts, but they need to have the right personnel and great coaching to make it effective.
Anyone disagree? Comment below if so.
Considering this, I find it funny that the biggest tactical innovation in recent times is South Africa’s Bomb Squad, i.e. put even more massive players on your bench. Not exactly subtle.
There is some positive correlation with success, but I don’t think it’s significant enough to trust considering the range of different contexts.
I admit I don’t really know what this stat means as Opta don’t provide a description, but I assume a higher number means more tackles.